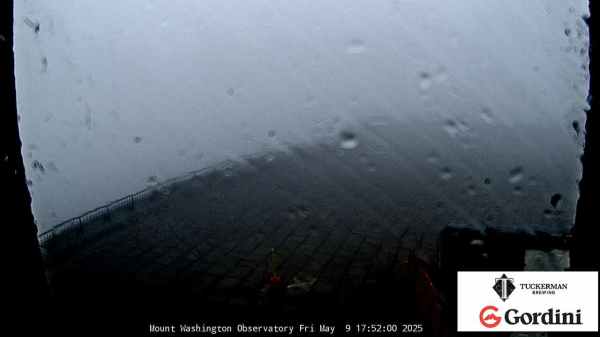
Seasonal Rainfall Summary (in)

Note: Data is updated after midnight each day.
Northern Hemisphere Meterological Seasons
Winter: December, January, February
Spring: March, April, May
Summer: June, July, August
Fall: September, October, November

 Daily DetailMonthly SummarySeasonal Summary 
Rainfall
DateWinterSpringSummerFallYear
Dec 2023 / Nov 202410.87 2.68 less than the Winter average.13.05* 0.11 more than the Spring average.------23.92* 23.79 less than the yearly average.
Dec 2022 / Nov 202321.00 7.45 more than the Winter average.14.72 1.78 more than the Spring average.11.45 2.9 less than the Summer average.2.66 4.21 less than the Fall average.49.83 2.12 more than the yearly average.
Dec 2021 / Nov 202210.74 2.81 less than the Winter average.16.23 3.29 more than the Spring average.24.98 10.63 more than the Summer average.9.79 2.92 more than the Fall average.61.74 14.03 more than the yearly average.
Dec 2020 / Nov 202112.57 0.98 less than the Winter average.23.03 10.09 more than the Spring average.22.55 8.2 more than the Summer average.13.47 6.6 more than the Fall average.71.62 23.91 more than the yearly average.
Dec 2019 / Nov 202019.86 6.31 more than the Winter average.14.61 1.67 more than the Spring average.22.88 8.53 more than the Summer average.12.12 5.25 more than the Fall average.69.47 21.76 more than the yearly average.
Dec 2018 / Nov 20199.63 3.92 less than the Winter average.6.00 6.94 less than the Spring average.6.91 7.44 less than the Summer average.5.28 1.59 less than the Fall average.27.82 19.89 less than the yearly average.
Dec 2017 / Nov 20186.76 6.79 less than the Winter average.5.16 7.78 less than the Spring average.4.65 9.7 less than the Summer average.3.30 3.57 less than the Fall average.19.87 27.84 less than the yearly average.
Dec 2016 / Nov 20175.61 7.94 less than the Winter average.7.87 5.07 less than the Spring average.14.03 0.32 less than the Summer average.2.73 4.14 less than the Fall average.30.24 17.47 less than the yearly average.
Dec 2015 / Nov 20167.00 6.55 less than the Winter average.8.16 4.78 less than the Spring average.6.46 7.89 less than the Summer average.1.35 5.52 less than the Fall average.22.97 24.74 less than the yearly average.
Dec 2014 / Nov 201513.00 0.55 less than the Winter average.12.32 0.62 less than the Spring average.12.28 2.07 less than the Summer average.5.46 1.41 less than the Fall average.43.06 4.65 less than the yearly average.
Dec 2013 / Nov 201413.68 0.13 more than the Winter average.21.03 8.09 more than the Spring average.11.22 3.13 less than the Summer average.9.05 2.18 more than the Fall average.54.98 7.27 more than the yearly average.
Dec 2012 / Nov 201326.93 13.38 more than the Winter average.12.64 0.3 less than the Spring average.12.70 1.65 less than the Summer average.12.52 5.65 more than the Fall average.64.79 17.08 more than the yearly average.
Dec 2011 / Nov 201218.48 4.93 more than the Winter average.13.41 0.47 more than the Spring average.22.13 7.78 more than the Summer average.4.67 2.2 less than the Fall average.58.69 10.98 more than the yearly average.
 
Max26.93 23.03 24.98 13.47 71.62
Avg13.55 12.94 14.35 6.87 47.71
Min5.61 5.16 4.65 1.35 0.00
 
Color Key
< 1.50 1.50 - 3.00 3.00 - 4.50 4.50 - 6.00 6.00 - 7.50 7.50 - 9.00 9.00 - 10.50 10.50 - 12.00 12.00 - 13.50 13.50 - 15.00 15.00 - 16.50 16.50 - 18.0018.00>
* denotes incomplete data for the month/year.

Script Developed by Murry Conarroe of Wildwood Weather.