N5PA weather
Latitude N 31° 37' 22" Longitude W 89° 14' 02" Elevation 289 ft
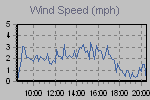
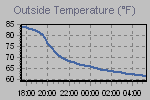
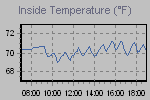
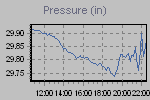
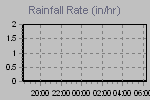
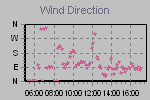
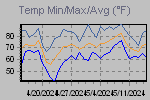
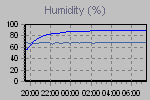
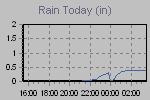
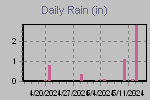
These graphs present the temperature, pressure, rainfall, and wind speed trends for the last 12 hours.
The thumbnail graphs are sampled every ten minutes. Click on a thumbnail to display the corresponding larger graph in the panel above it. The large graphs are sampled every minute.
 |
||||
| Click on a thumbnail to show a large graph in the panel above. | ||||
 |
 |
 |
 |
 |
 |
 |
 |
 |
 |
| :now::gauges::today::yesterday::this month::this year::records::monthly records::trends::forum: | ||||
Page updated 4/26/2024 7:10:00 PM
powered by
Cumulus v1.9.4 (1099)